Introduction
I don’t recall exactly how I ended up going down this rabbit hole, but I believe it started with trying to find forecast data for surfing. I had thought it would be interesting to draw a heat map showing areas with large swell, but light wind. I ended up abandoning this idea because there are already a ton of good forecasting tools for surfing, but in the process I stumbled across another, less well explored idea.
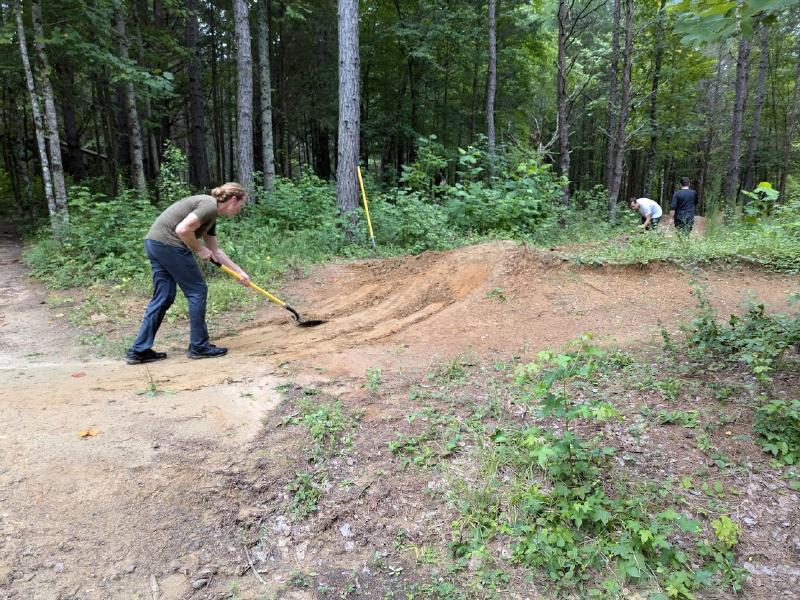
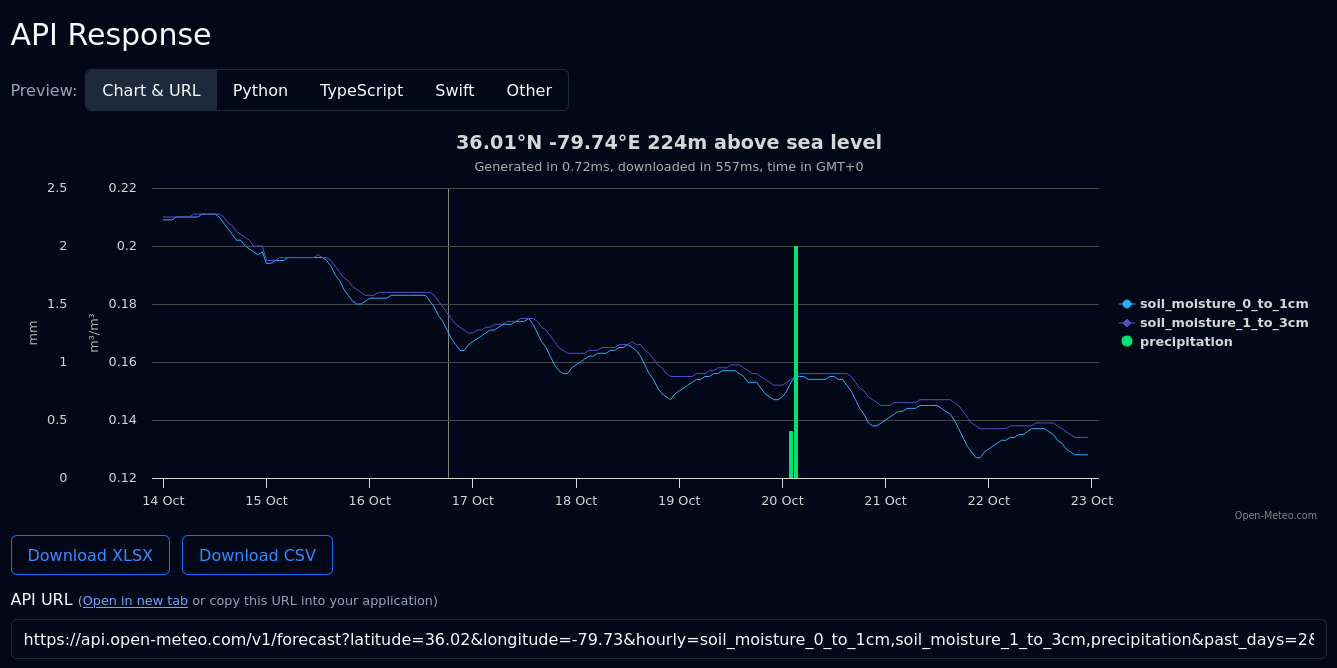
Open-Meteo provides a wealth of interesting forecast data ranging across a broad spectrum of different dimensions. In exploring what was available, I ran across a soil moisture measurement that piqued my interest. In the past, whenever I was trying to determine if a mountain bike trail was worth riding or not, I would have to go and look at the previous week’s rainfall totals and then try to guess if it was going to be muddy, or dry, or somewhere in between. What if you could use this soil moisture measurement instead? After all, I don’t care when or how much rain we got as long as the dirt is in prime shape for good riding.
If you don’t know what “hero dirt” is, you could define it as an annoying term describing the perfect conditions for whatever kind of riding you’re doing. If you’re trail riding, slightly soft, tacky dirt is great for cornering and braking performance. If you’re doing dirt jumps, you want it to be slightly drier and more hard packed for high speed runs. And if you’re bombing down steep inclines at a lift park, ideally there should be at least three inches of standing water in every mud hole and wet root tangle on the mountain for maximum enjoyment. But regardless of the specific conditions you’re looking for out of a trail, the dominant variable is water content, and I had a way to directly measure that for any point on the map.
Technical details (or not)
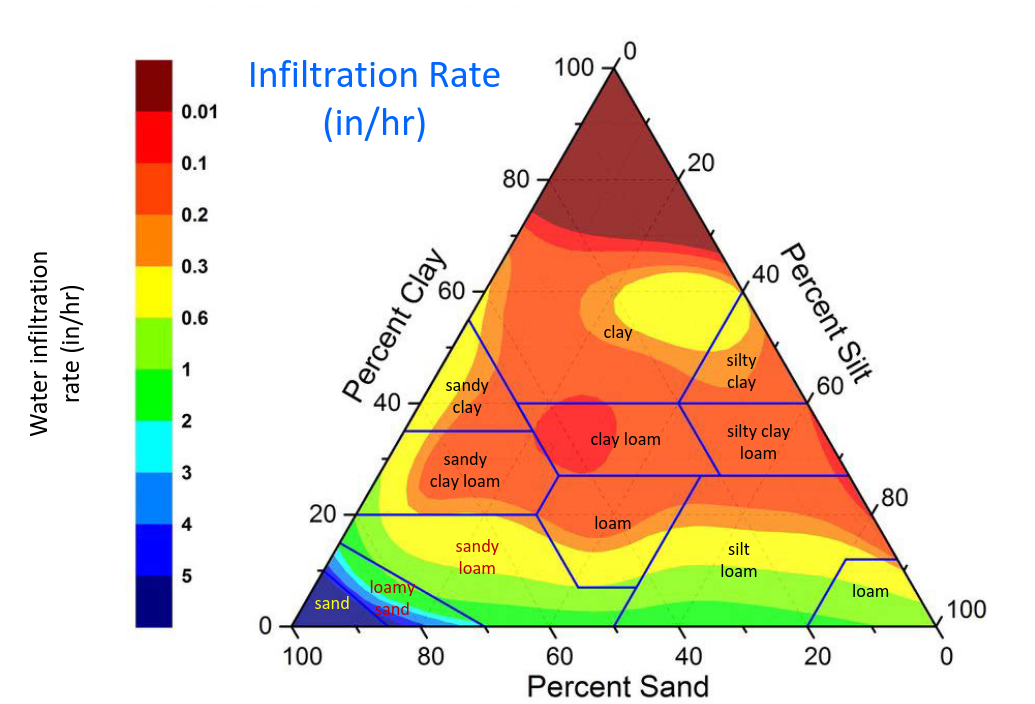
I had planned on doing a little more research into the topic of soil science, but as I dug deeper, I uncovered a dizzying array of jargon and unfamiliar terminology that was daunting to say the least. Permanent wilting points, slope gradient averages, available water storage, fluvaquents and torrifluvents, temperature regimes, and so many more esoteric terms and vocabulary that I didn’t even know where to start. I am continuously amazed at the depth of knowledge surrounding even seemingly simple topics like “how dirt works”. Someone or more likely many someones, somewhere, have dedicated their entire lives to studying dirt in the piedmont region of North Carolina. I’m happy to leave them to it.
Initially I had thought it would be interesting to use a soil survey map like this one from ArcGIS to construct a model for predicting what a good moisture content range would be. But as I tried to unravel the mystery that is soil science, I came to the conclusion that there are far too many variables to consider when trying to work out what the “capacity” would be for any location.
For example, we all know that the moisture in the soil comes from, you guessed it, rain. But do you know the four ways moisture can leave the soil? I didn’t when I started this project, but if you’ve made it this far, I assume you might want to know the answer. It’s runoff, drainage, evaporation, and transpiration. Runoff occurs when rain pools up on the surface and literally runs off the trail. This is the purpose of water bars and other features meant to control the flow of water over the surface of the trail. Drainage on the other hand is the process by which water is absorbed into the soil and through gravity works its way into the water table. Evaporation is, well when water evaporates; there’s no big mystery here. And finally transpiration is where water is removed from the soil by the foliage through their root systems and eventually through their leaves.
On top of all of these factors, you have to consider the direction of the trail slope (north gets less sun and remains wetter due to lack of evaporation and less transpiration), the overall grade of the trail, the texture type of the soil, the trail itself and how well built it is, etc. So rather than try to correlate all of these factors and build a reliable model, I decided the best path to victory would be to take direct observations of trail conditions and correlate those observations with soil moisture readings on those days. Over time this should give me a pretty good idea of what the ideal values would be for any given trail network. Over the past few days now I’ve been collecting information about the conditions on the ground at common trails I ride and making a simple range capturing the ideal moisture content for a given area. The Farm, for example, runs best at or below 0.300 water content by volume, and for a really fast day, you should have as low as 0.22 or less. Of course too dry and you end up with lots of dust and sandy patches, so the sweet spot is right at 0.25 or so, at least based on my most recent observations.
I was about to put a wrap on my research phase and start writing the code for my website when the thought crossed my mind that I didn’t really know how these forecasts are done in the first place. Do soil scientists wake up every day, go outside with a little instrument and drive around the countryside taking readings? I couldn’t imagine this was the case. But if not that, how? Permanent base stations that take readings daily? Nope. Satellite imaging is the answer. It doesn’t seem possible to me that you could actually get reliable readings from space, but it is and the science behind it is fascinating.
Anyway, at this point I’ve exhausted my interest in soil science and this post is already more in depth than I had ever actually intended it to be, so I’m going to end it here. If you want to see the code for the forecast, check it out in your browser’s developer tools. I didn’t write it all by hand, but the AI I did use to write it was limited to generating the boilerplate, so I’m going to take credit for this one. Thanks for reading!